When it comes to uncovering the truth, math is often the best way to find out what is truly right. More often than not, politicans have delayed tackling the problem of income inequity, labelling it as a natural consequence of capitalism which should not cause concern. Thankfully, the Gini Index allows us to debunk this claim and depict the impact income inequality has on society. As we calculate Gini Coefficients, we can use that information to make inferences on society, which can than fuel change in our communities. Economists use the Gini Coefficient as a way of measuring income inequality across an entire population which, in return, they can relay to government officials who have the potential of introducting legislation which can combat the issue. As we continue in this presentation, we will look at real life data which we can use to make inferences about the severity of income inequality in the United States. We will also establish potential factors that are contributing to the problem.

The expression xn represents some sort of exponential function that increases in a non-constant way. When we look at L(x), we can see that it does not increase in a constant fashion; therefore, it must be an exponential function. Now, we may not know whether L(x) is a quadratic, cubic, or quartic function, but it is reasonable to use the expression xn because at the very least, we know that the Lorenz Curve is some sort of an exponential function.
We can estimate L(x) to be x2. As stated earlier, we know that the Lorenz Curve must be depicted by an exponential function. When we plug in values from the curve into x2, we get outputs that are very close to the ones that are given to us. For example, when x is equal to .2, L(x) gives us .038, while our estimate gives us .04. Similarly, when x is equal to .4, L(x) gives us .133, while our estimate gives us .16. Since the values of the approximation are close to the actual given values of the Lorenz Curve, we can estimate L(x) to be equal to x2.


In order to calculate the Gini Index of the US, we plotted the points from the given table and estimate an expression for the Lorenz Curve. After, we found the area of the region bounded by the extreme of perfect equity and the Curve through integration. Our findings are above in the graph on the left.
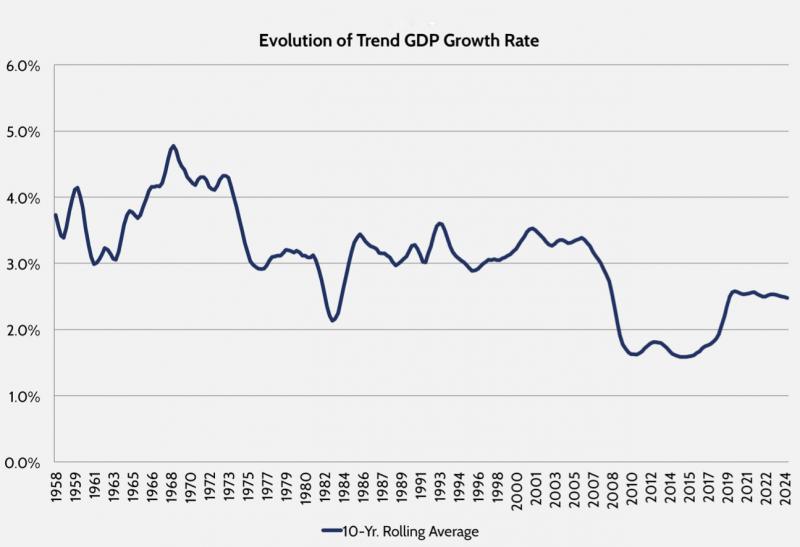
When we look at the graph on the left, we can see an evident, steady rise in the Gini Index of the United States. When we consider what it means in terms of income inequity, we can establish that from 1967 to 2014, income inequality in the United States has worsened steadily; in other words, the distribution of wealth within the United States has gotten progressively worse. Looking at overall trends, the US income distribution for the bottom four-fifths of the country decreased from 56.3% to 48.8%, while that of the top fifth percentile increased from 43.7% to 51.2%. The data projects that as time continues, the wealth distribution will only worsen, as the small population of wealthy citizens will make a more significant portion of the aggregate income. This data does not bode well for our future: if the country continues on the same path, our Gini Coefficient will approximately increase by 17% (up to .541) by 2035, as projected by the Congressional Budget Office. Income inequity targets all aspects of society, but arguably, it harms our economy the most. With a steady rise in its Gini Index, the United States runs the risk of stagnating its economy: as a larger share of income goes to affluent households, aggregate demand growth (spending by families, businesses, and governments) becomes suppressed. The graph on the right shows the US GDP growth rate from 1958 projecting to 2024, as given by the US Chamber of Commerce. The slowing growth rate is a clear consequence of income inequality. Those who reject income inequality argue that the wealthy making a larger portion of the national income should be considered a remarkable feat, as they will spend and invest in the economy, a belief that Republicans have held since Ronald Reagan took office. Yet, this is the very essence of the problem: research by the Economic Policy Institute shows that wealthy households are saving their income rather than spending it, leading to slower growth. Politicians have tried to limit income inequity through declining interest rates; however, this approach will not be sustainable in the future as income inequality grows. The graphs above show the lack of adequate success from policies of the past and call for action that grow wages for the lower and middle class. To reverse the trend of increasing inequality, we, as a country, must raise the living standards of American families through policies that will encourage wage growth so that we can assure economic growth.